Territory Design Based on Manufacturing Plant Density
Aligning sales territories to plant clusters rather than geography can lift revenue 2 to 7 percent.

Territory design in industrial sales still mostly runs on geography: state lines, zip code clusters, sometimes just splitting the map into equal chunks so each rep "gets a fair shot." That approach is failing more often than it's working. Per Sales Management Association research from 2024, 58% of B2B companies rate their own territory design as ineffective, and the geography-first habit is a big reason why.
A map drawn by square mileage hides the thing that actually matters: where plants are. A rep covering a sprawling rural patch and a rep covering a dense industrial corridor might have territories that look the same size on a slide deck, but they're operating in completely different revenue environments. One drives two hours between qualified stops. The other can hit five plants before lunch. Draw the lines by geography and you'll end up with coverage gaps where plants cluster just outside a rep's assigned patch, over-assigned reps whose time gets stretched thin across empty ground, and quota numbers that feel made up because, in a real sense, they were: built on land area, rather than on where the buyers actually are.
The fix starts with a different unit of analysis. Plant density is what converts, far more than square mileage. A territory built around where facilities concentrate reflects the real distribution of opportunity; one built around administrative boundaries reflects nothing but the boundaries themselves. Harvard Business Review research has found that optimized territory planning can produce a 2 to 7% revenue lift without adding a single new rep. That revenue was already sitting there, just poorly assigned.
How U.S. manufacturing employment and plant counts are actually distributed
The country had roughly 12.8 million manufacturing jobs as of late 2024. That number on its own says very little, because the distribution across states and counties is wildly uneven, and unevenness is exactly what a good territory plan needs to account for.
California leads in raw employment, with 1,247,594 manufacturing jobs spread across 44,838 establishments. Do the division and you get a lower average headcount per plant than you might expect from a state that size, which points to a mix of large operations sitting alongside a long tail of smaller specialty shops. Texas tells a different story: 973,674 jobs across 30,070 establishments, fewer plants but higher average employment per facility, anchored by chemicals, energy equipment, and aerospace. Same rough job count in the same order of magnitude, completely different plant structure. A rep selling into Texas is walking into fewer, bigger buildings. A rep selling into California is covering more ground with more variety per stop.
Then there's the Midwest. Ohio, Michigan, Indiana, Wisconsin, Illinois, and Pennsylvania don't just carry high plant counts, they stack subsectors on top of each other: OEMs sitting near machine shops, finishing houses down the road from plastics processors, components and maintenance shops filling in the gaps. That stacking compresses travel time between qualified prospects in a way that raw plant count alone doesn't capture.
For specialty chemical and metalworking fluid sellers, the picture splits into two distinct density types. Breadth of plant count concentrates in California, Texas, Florida, New York, Ohio, and Pennsylvania. Larger-plant footprint states, meaning fewer facilities but each one consuming more per account, include Mississippi, Kentucky, Indiana, Iowa, Alabama, and South Carolina. A territory strategy that treats these two density types the same will misallocate reps in both directions.
County-level subsector data adds one more layer that state totals simply can't provide. Knowing which counties concentrate food processing, which anchor metal fabrication, and which run heavy plastics changes how a rep sequences calls inside a territory, not just which territory they're assigned to. State-level numbers won't produce that kind of routing intelligence. Flatten all of this into equal-area regions and you systematically under-assign reps to the densest corridors while over-assigning them to the sparse ones, which amounts to a core design flaw rather than a rounding error.
Where manufacturing density is shifting — and what that means for territory design today
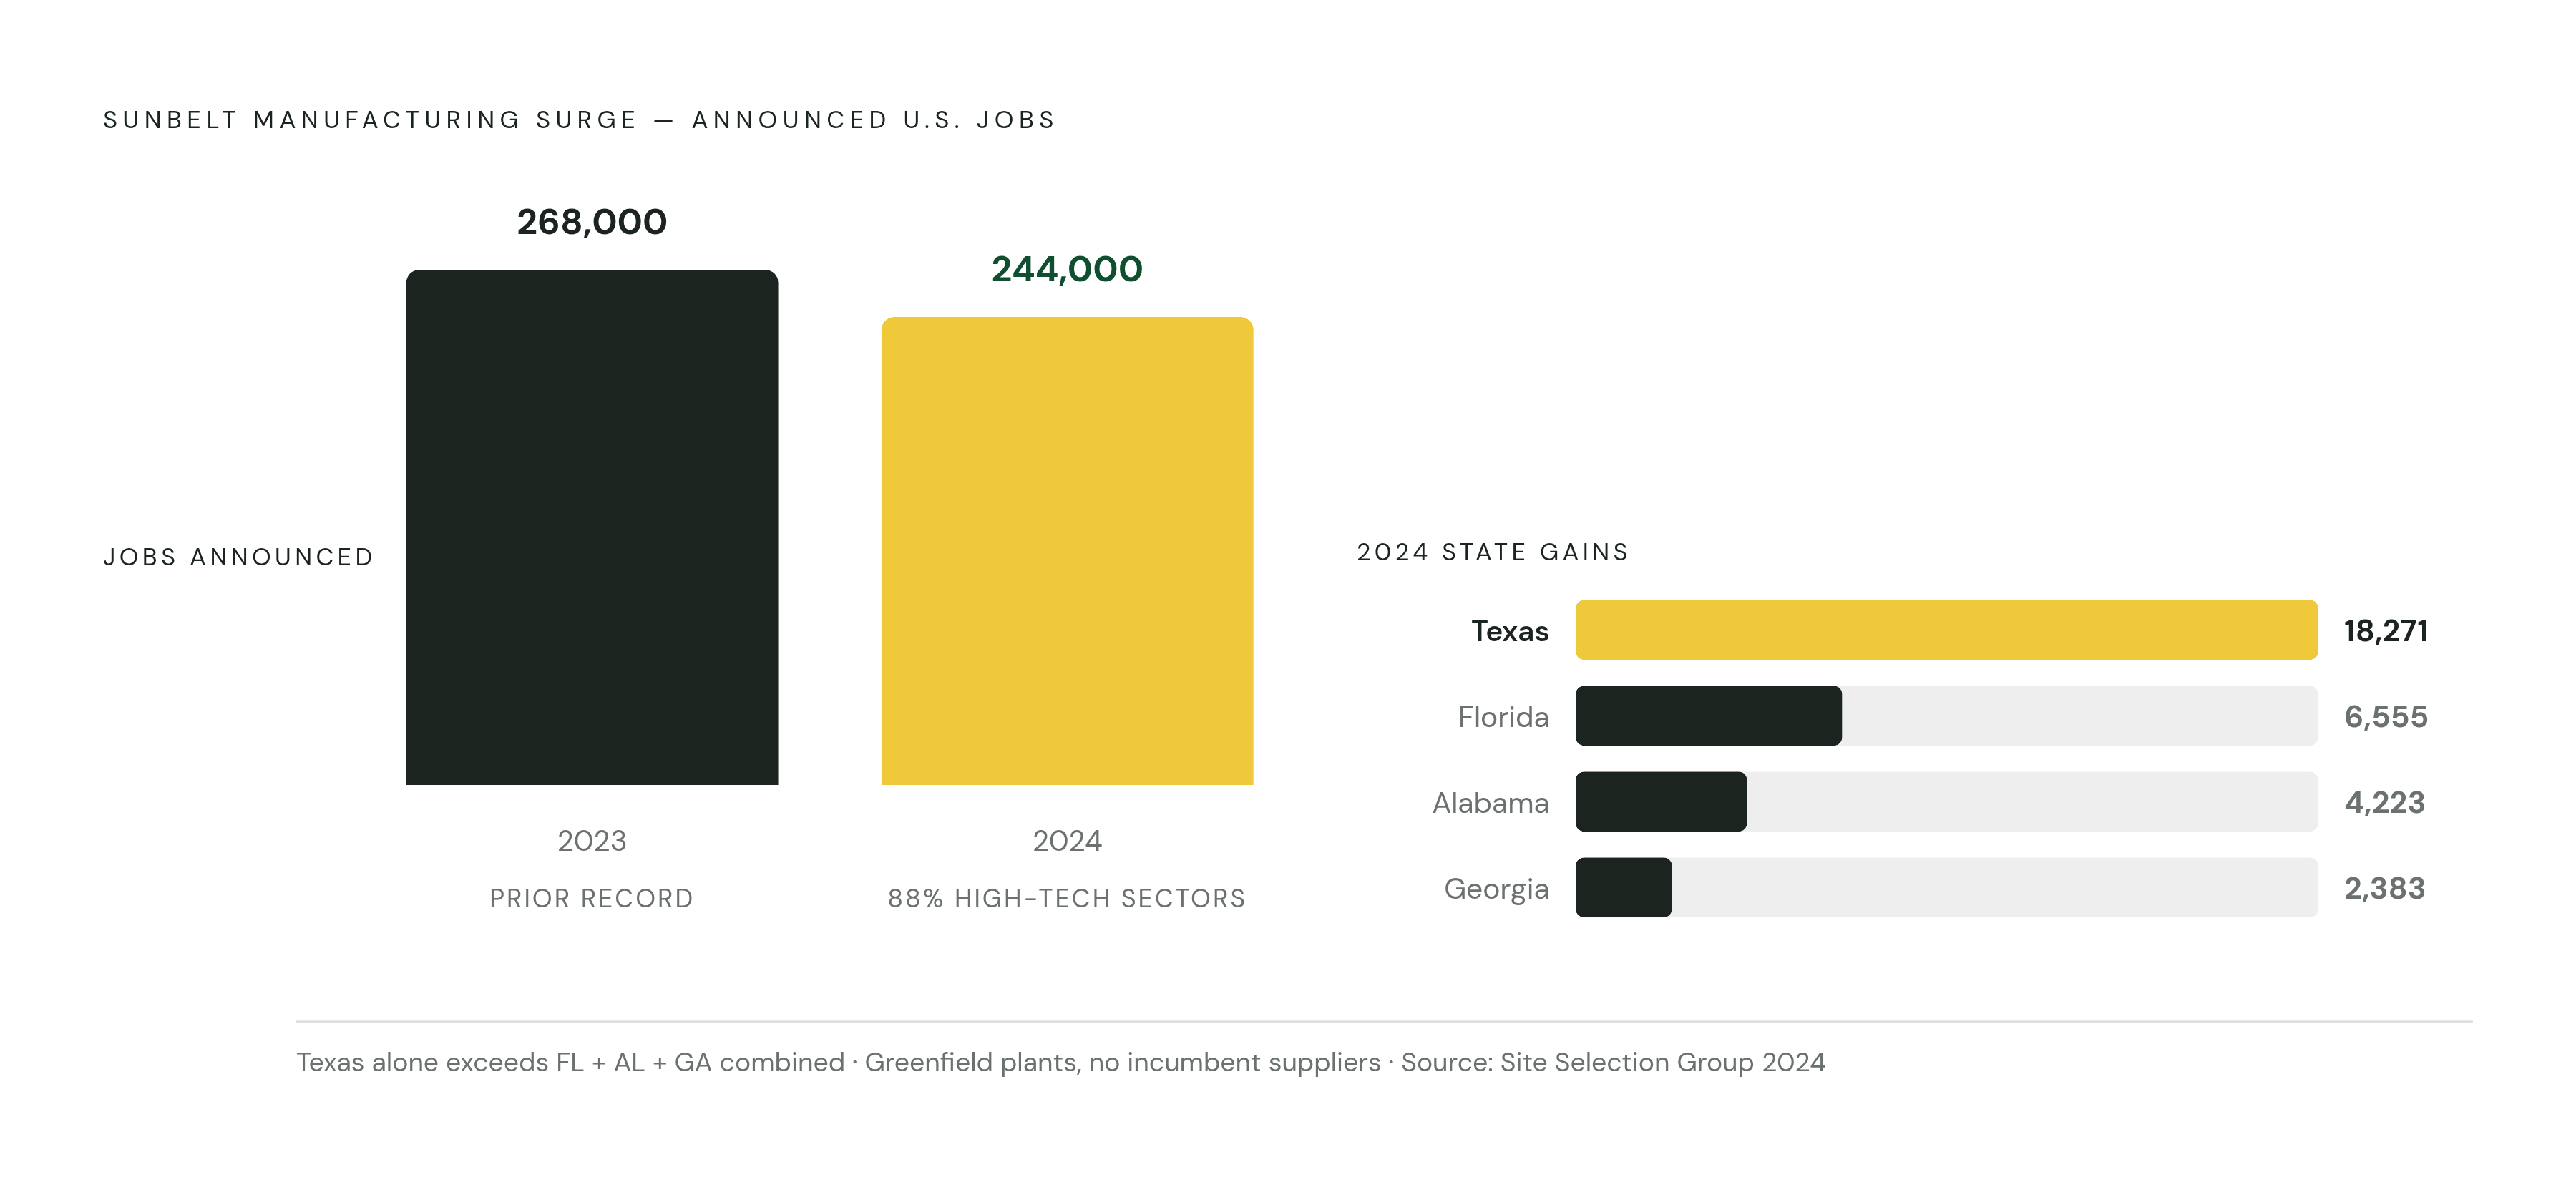
Density isn't fixed, and treating a plant map as a static asset is its own quiet failure. Reshoring and foreign direct investment drove 244,000 announced U.S. manufacturing jobs in 2024, the second-highest year on record, trailing only 2023's 268,000. That's two years running of real movement, not a blip.
The composition of that movement matters as much as the volume. 88% of the 2024 announced jobs landed in high or medium-high tech sectors, according to the Reshoring Initiative — a shift away from the legacy industrial mix a lot of territory maps were built around a decade ago. That's a shift away from the legacy industrial mix a lot of territory maps were built around a decade ago. Manufacturing construction spending backs this up at scale, reaching $237 billion by mid-2024, an 86% rise over two years. The physical infrastructure for a new density pattern is being poured in concrete right now.
Look at which states are gaining fastest: Texas added 18,271 manufacturing jobs in 2024, Florida added 6,555, Alabama added 4,223, Georgia added 2,383. These are Sunbelt states, historically lower on the traditional industrial density scale than the Midwest stack described above.
That shift creates a specific kind of opening. A new plant has no incumbent supplier relationships; it's a clean entry point with no entrenched vendor to displace. The window to land on an approved vendor list is widest during ramp-up, before production schedules lock preferences in place. Miss that window and the account gets harder to crack for years. A territory plan built entirely on historical plant data misses these windows by default, because by the time the data reflects the new plant, the vendor list is often already set.
Phoenix, Dallas-Fort Worth, and Salt Lake City are worth flagging specifically as emerging clusters drawing new investment, partly on energy availability and workforce access, both of which are now primary drivers of site selection decisions. The upshot is plain: a density map built on historical data is already going stale, because the real map is being redrawn in real time, and static planning cycles can't keep pace with that.
Why plant-level data is the only input that makes density mapping meaningful
Company-level data hides more than it reveals. A single parent company can operate plants that make consumer goods, industrial components, and specialty materials under one corporate umbrella, each with different buyers, different specs, different purchasing cycles. From the outside it reads as one account. On the ground it behaves like three or four separate ones.
NAICS codes and headcount figures don't tell you what a plant actually makes or at what volume, what processes run on the floor, what equipment is installed, or whether the facility is expanding, idling, or converting to a new product line. Two plants can carry identical NAICS codes and near-identical headcounts and still represent wildly different revenue potential for a specialty chemical rep, because one plant runs a process that consumes fluids in real volume and the other doesn't touch the category at all. Treat them as equivalent and you inflate the apparent value of one territory while quietly deflating another.
Plant-level profiling closes that gap. It lets a company score facilities by actual production fit rather than a NAICS approximation, separate which clusters inside a territory are genuinely qualified from which are just physically present, and route reps toward plants where the production signals actually match the product line, not just toward whatever's nearby on the map.
Facility-level platforms built for industrial sales index manufacturing plants with detailed data points per facility, covering what each plant makes, what equipment it runs, production volume, and real-time activity signals. The goal is specifically to let industrial sales teams map territory value at the facility level instead of the zip code level, distinguishing facility-level profiling built from production reality from a company record with a code stapled to it.
How to structure territories around plant density rather than geography
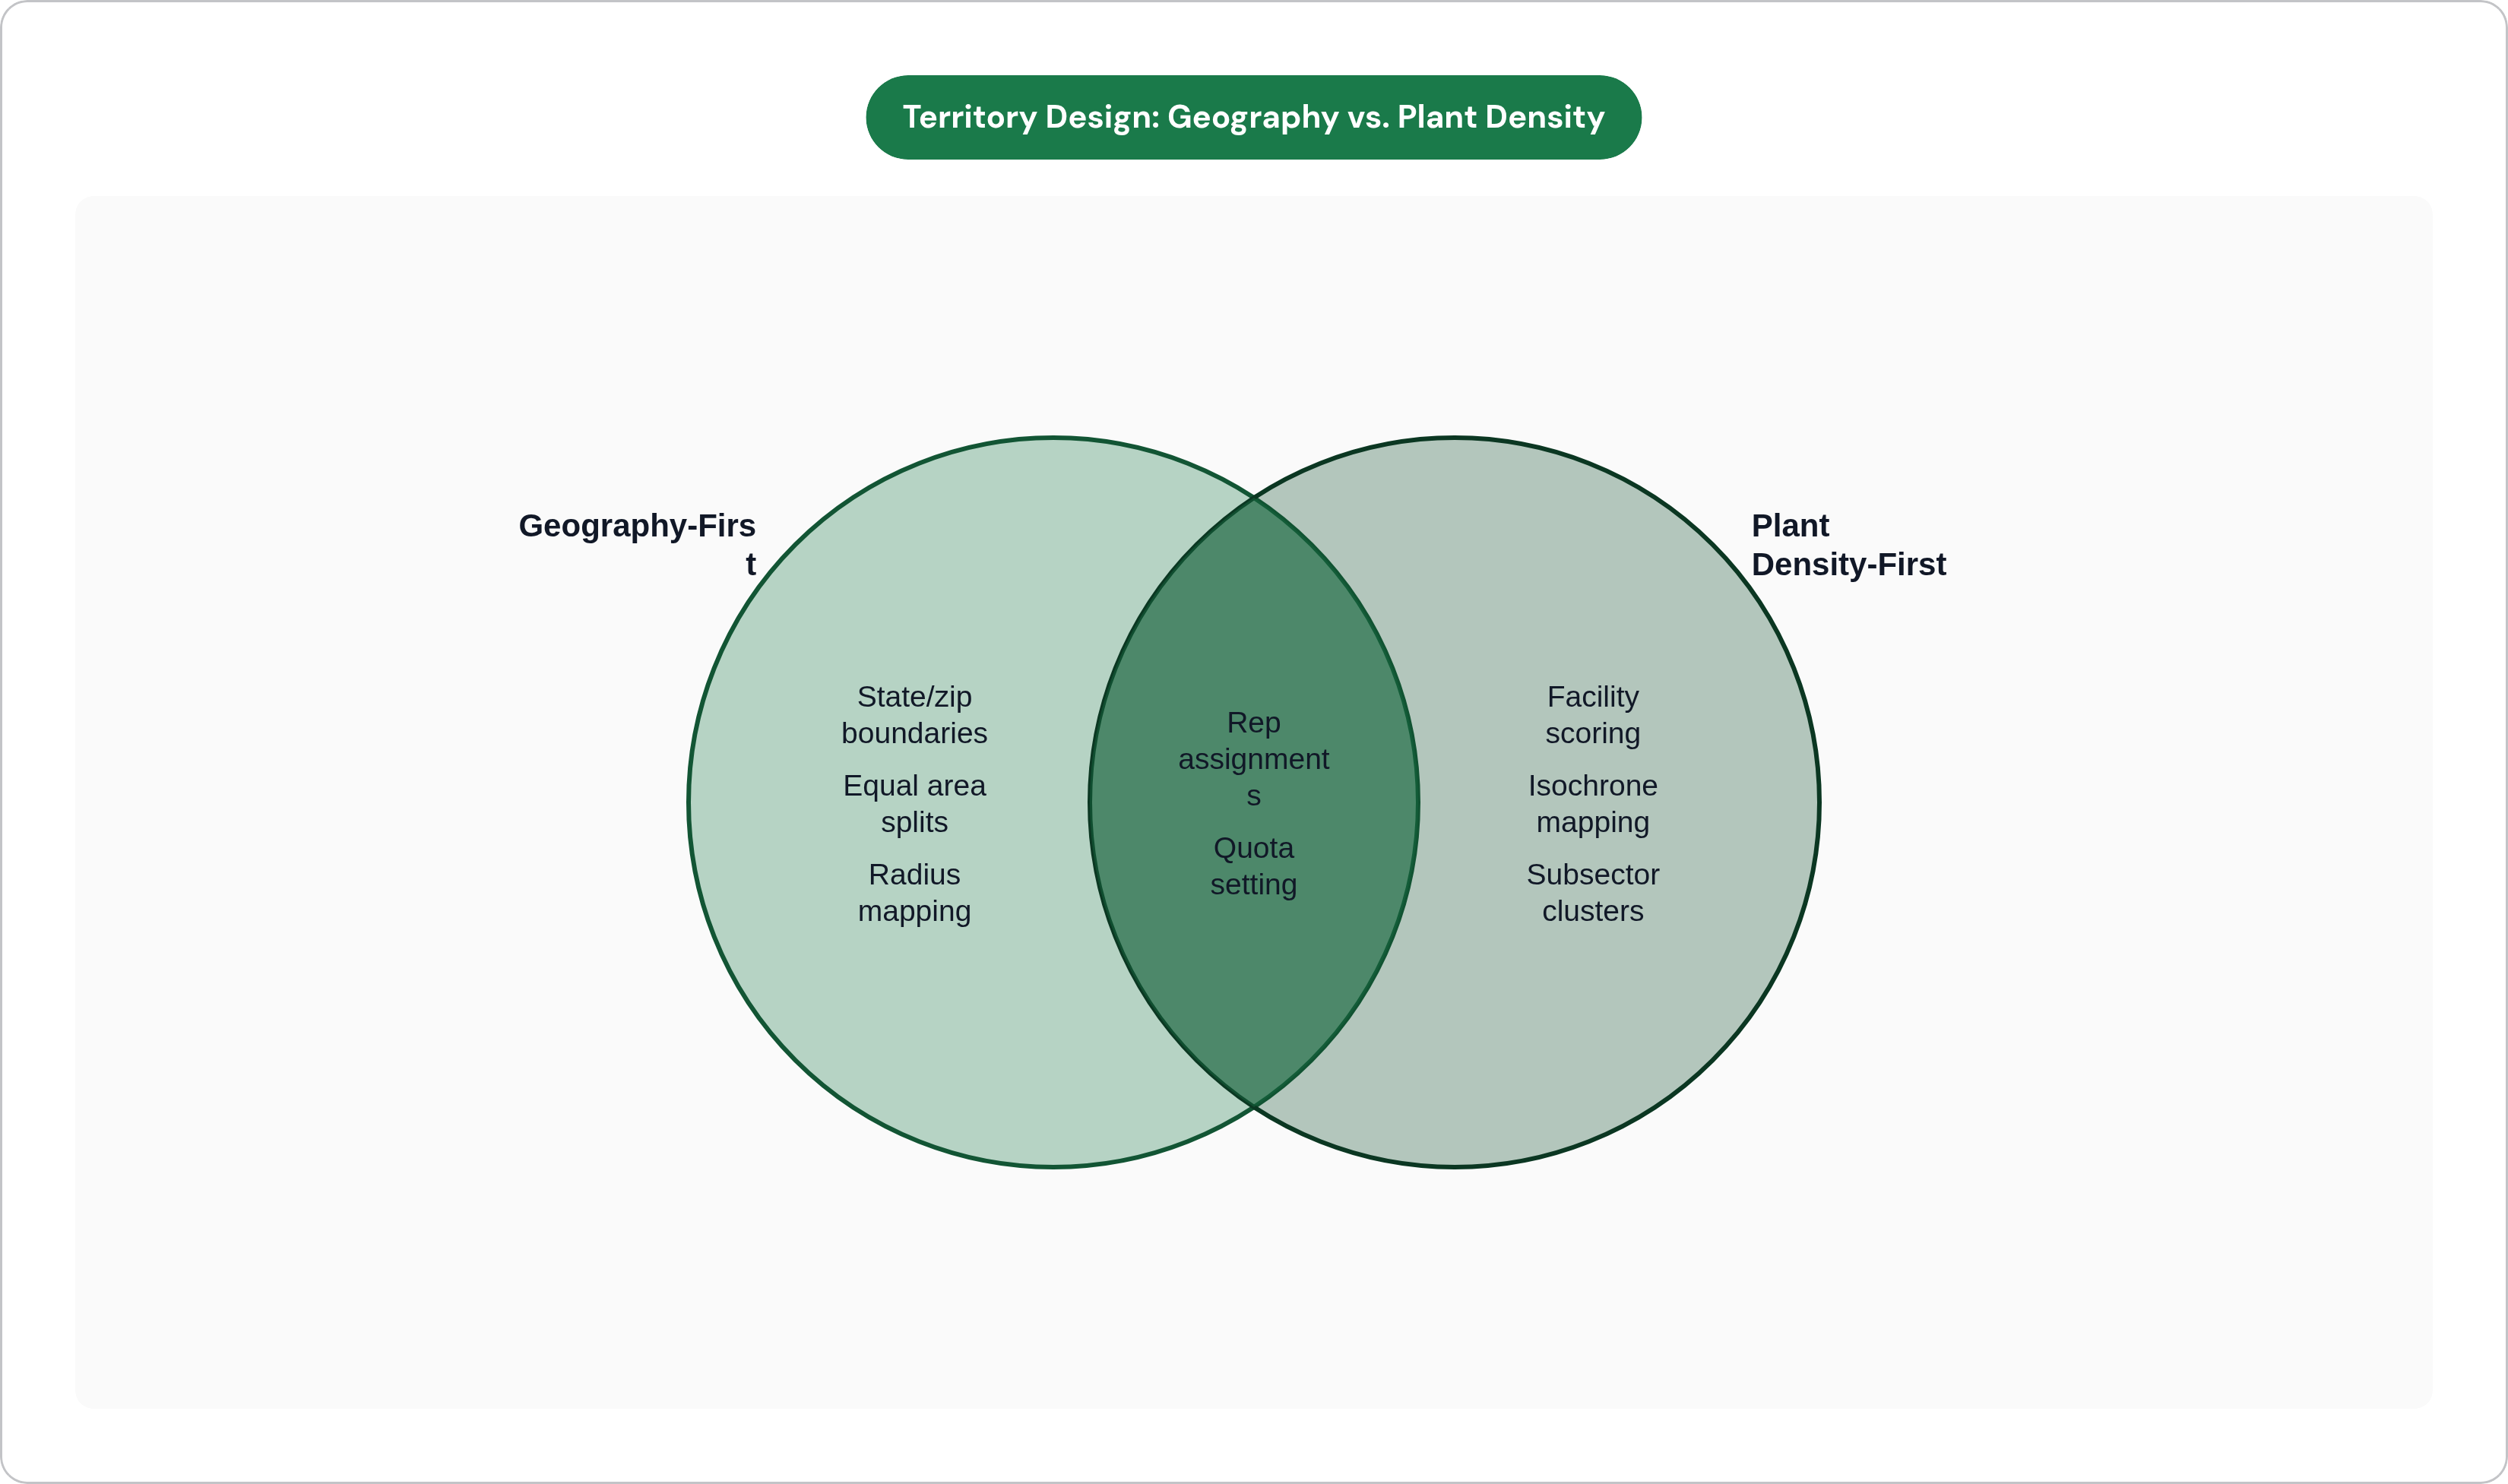
Start with facility scoring, not boundary drawing. Pull every facility in the target market that fits the product's process profile, then score each one on production fit, estimated consumption, and near-term signals like expansion activity, equipment changes, or new product lines. The scored facility map is the raw material here. Territory lines come after that scoring, never before it.
Once the facilities are scored, map where the density clusters actually sit, whether that's an industrial corridor, a county-level subsector cluster, or a metro manufacturing park. These clusters form natural territory cores. A rep centered on a dense cluster spends less drive time per qualified call than one spread across sparse ground, and that gap compounds every single week.
Drive-time logic beats radius logic every time in manufacturing-heavy areas. Isochrone mapping, meaning territories built on actual drive time instead of arbitrary geographic circles, produces very different assignments depending on where you're drawing them. A 60-minute radius in metro Detroit covers a totally different density of plants than a 60-minute radius in rural Ohio, and isochrone tools account for real road networks and traffic in a way a compass-drawn circle never will.
Balance the load by qualified facility count, rather than by area. Each rep's territory should carry a workable number of scoreable accounts, enough to build real pipeline, not so many that coverage stays shallow everywhere. In practice this compresses territory boundaries across the Midwest dense-stack and expands them across lower-density Sunbelt markets, the reverse of what a geography-first map tends to produce.
The right territory structure depends on the product. Pure geographic territories still make sense where the product applies broadly and density is the main differentiator. Industry-based or hybrid territories fit specialty chemicals and metalworking fluids better, since process knowledge itself is a differentiator and reps need real familiarity with a specific production environment. Hybrid models, geography layered with subsector, are the default for multi-product sellers whose fit varies plant to plant. And reshoring zones and greenfield clusters deserve their own segment entirely; they need different coverage logic than mature markets where supplier relationships are already locked in.
Treating territory design as an active practice, not an annual event
An annual territory review can't keep pace with plant openings, expansions, idling, or the reshoring-driven shifts described above. By the time the review happens, the map it's built on may already be six months out of date.
Active territory management runs on a quarterly cadence tied to real plant signals, meaning construction announcements, equipment changes, and production expansions, rather than rep performance numbers alone. Rebalancing gets triggered by specific events: a new plant opening in a rep's territory that wasn't there last quarter, a facility going idle that was anchoring the territory's revenue model, or a neighboring territory's density rising enough to justify a split. Tracking both inputs, like qualified doors touched and conversations per facility type, alongside outcomes like coverage rate and revenue per cluster, is what tells a team whether the territory design itself is the constraint or whether it's simply rep effort.
None of that works without current data underneath it. A territory built on plant-level data stays useful only as long as the facility records behind it stay current; stale enrichment produces the same coverage gaps as a bad map, just with a delay before anyone notices. Platforms that feed facility intelligence directly into CRM records, Platforms that feed facility intelligence directly into CRM records let territory managers see when a facility's production profile changes without pulling a separate report every time.
There's a common instinct worth correcting here. When a new rep joins or a new region opens, the reflex is to split existing territories geographically, right down the middle. A more useful approach is to re-score facility density first and draw the split where the density actually supports two viable territories, rather than where the map happens to have a convenient line. Emerging territory tools are helping align distribution networks, dealer coverage, and direct sales forces with where manufacturing activity and capital spending are concentrated. But none of that output is better than the facility-level data feeding it.
What a density-first territory produces for the rep working it
The change for the rep is immediate and practical. Instead of spending the first weeks in a new territory figuring out which accounts even matter, the rep starts with a pre-qualified map of facilities that already fit the product's process profile.
That eliminates a lot of front-end guesswork. Knowing what a facility makes, what equipment sits on its floor, and what it's likely to buy before the first call means the rep shows up with a real reason to be there, rather than a cold introduction to an operation nobody's bothered to research. Routing becomes deliberate too: in a dense industrial corridor, a rep can run four or five qualified calls in a single day instead of one or two separated by long drives to prospects that may not even pan out. Drive time is a measurable drag on productivity in industrial sales, and density-based routing cuts it structurally, not through sheer individual hustle.
Account growth follows the same logic. A rep who knows what a facility actually makes can reason out what else it probably needs, so cross-sell and upsell ideas come from production reality instead of a gut-feel conversation at renewal time. Multi-plant accounts look completely different once every facility gets profiled on its own: one plant might already be a customer while two others under the same parent company sit uncovered, invisible on a company-level record.
The buying committee doesn't get any smaller. Manufacturing purchases still typically run through procurement, engineering, quality, and plant management, often all four. But walking in with plant-level production knowledge shortens the credibility-building phase with each of them, because the rep isn't starting from zero. That's the real measure of a density-first territory: the gap between a rep who fills a calendar with meetings and a rep who builds pipeline that actually closes.